Share Trading Courses >> Technical Analysis Course >> Candlestick
History of candlestick patterns
Started in Japan few hundred years ago, for rice trading candlestick charts were used. It got recognition mostly in 1990s in stock market. The candlestick charts provides same information as the bar charts. But in candlestick charts the prices appears more visually appealing to analyze than bar charts.
Disadvantage : they take more horizontal area to be shown than bar charts. So that a limited number of candlesticks can be shown in same display area compared to bars.
Bar chart & candlestick chart compare
But keep in mind BAR chart and Candlestick charts provides same information
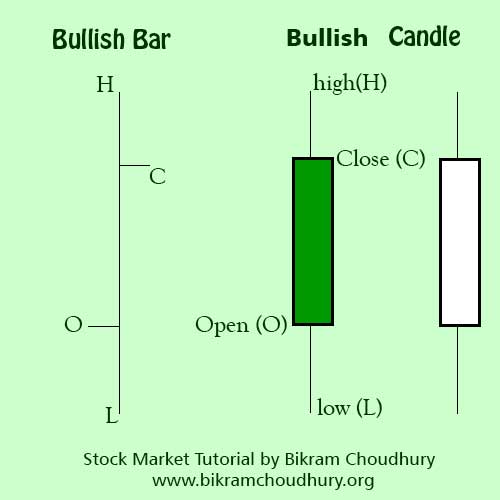
Bullish Bar chart & candlestick
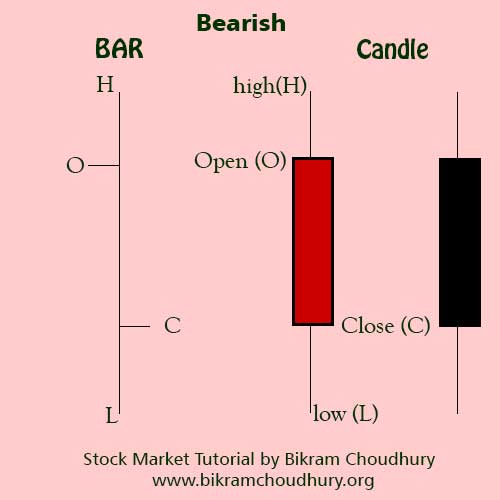
Bearish Bar & Candlestick
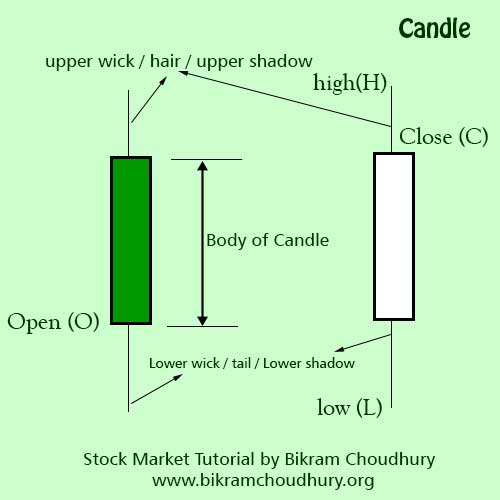
Body Hair Tail Shadows of CandleStick Charts
Candlestick chart patterns stays for next 5 to 10 candles, e,g If you pick up an hourly candlestick pattern then it stays for next 5 to 10 hours. Monthly candles stays for next 5 to 10 months. Candlestick patterns are valid for any time frame. Daily and weekly candles has more significance than Intraday chart candles.
Reference Reading :
Stock Market Investment + Money Protection > Learn Option Trading