Share market technical analysis courses in Kolkata on Indian Stock Market. Learn how to trade in stock market using charts, bar chart, candlestick charts, technical indicators and many more. Live online technical analysis classes for all India students also available in Hindi, English & Bengali language.
Technical Analysis Online Courses

Technical Analysis For Beginners – a stock market technical analysis online course in Bengali language. Click here to learn technical analysis for beginners courses in India Bangladesh. This online course is in Bangla, suitable for Kolkata, West Bengal, Bangladesh & India’s Bengali speaking persons.
Learn share technical analysis to detect trend reversal & buy sell accordingly
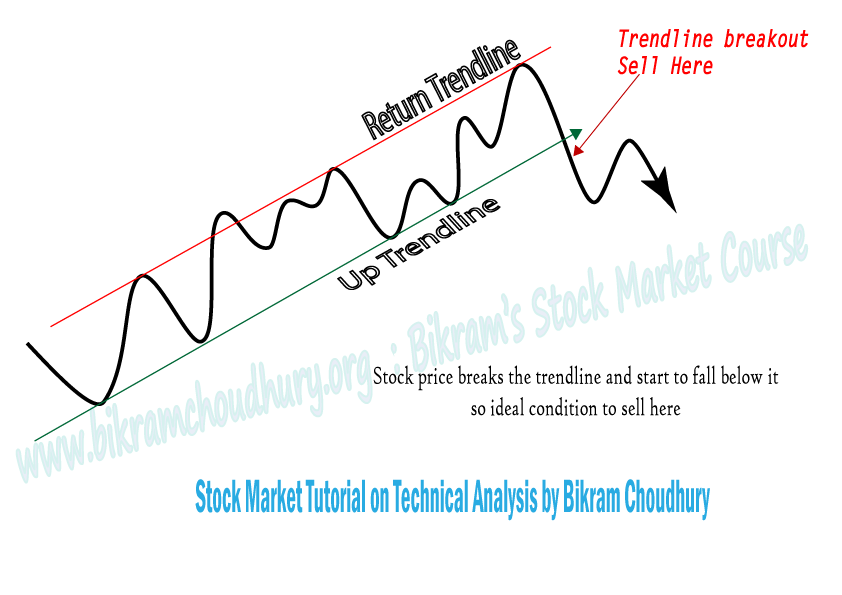
Case Study 1 : Stock Trend , price breaks uptrend line and trend reversal- share technical analysis tutorial by Bikram Choudhury
Technical analysis course content
- When to buy a stock and when to exit from it.
- By technical analysis you can assume whether the stock price will rise or fall in near future.
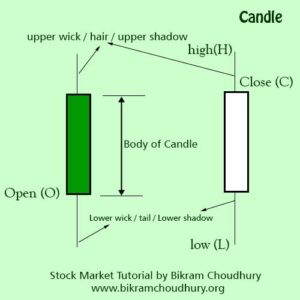
- How to trade with chart patterns : OHLC Bar Chart, Candle Stick Chart patterns, line graphs.
- How to trade using various technical indicators like MACD, Moving Average, Stochastic RSI, EMA, DEMA, SMA etc.
- Identify support and resistance level.
- Learning Technical Analysis has become a traders tool for long time.
Technical analysis tells us about the trend of a stock. It tells us whether a stock should be bought now or shall I wait or shall I sell it now. It tells us the perfect timing to trade.
Why you should learn technical analysis?
By technical analysis you can identify the trend changes at an early stage and you can follow the trend until you get some evidence or clear cut indication that the trend has been reversed. That is the downtrend converted to an uptrend or an uptrend reversed & changed into a downtrend.
The trend reversal, whether the trend has changed or not, this evidence can be obtained by various technical indicators and also by some rules of Technical Analysis.
As per DOW Theory you should always assume that the previous trend is in motion until you get enough proof that the previous trend (which can be an uptrend or a downtrend) has reversed.
By technical analysis , you can identify the direction of trend, but it cannot tell you tell you how long the trend will will stay active. But by technical analysis you can understand, whether the previous trend has been reversed or not not?
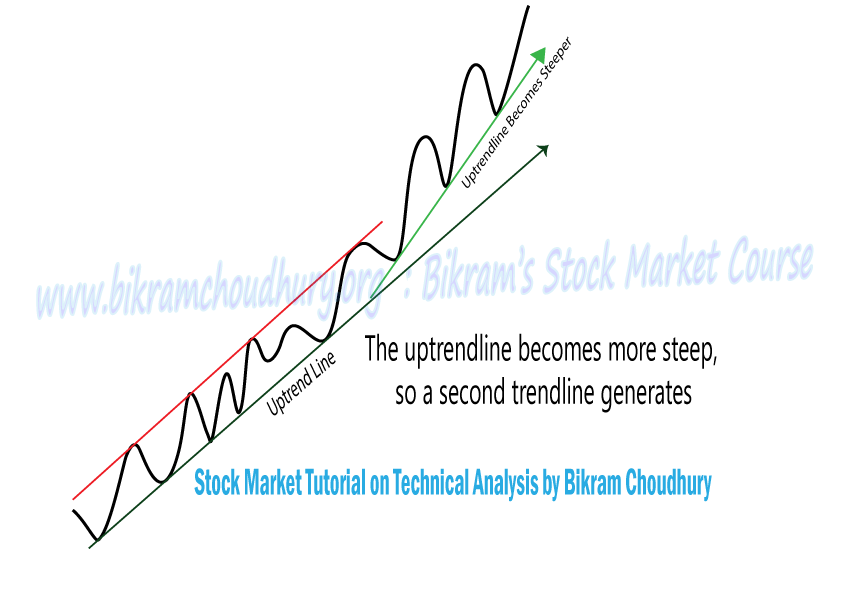
Case Study 2: The Uptrend Line of Stock price becomes more steep, and a second trendline generated
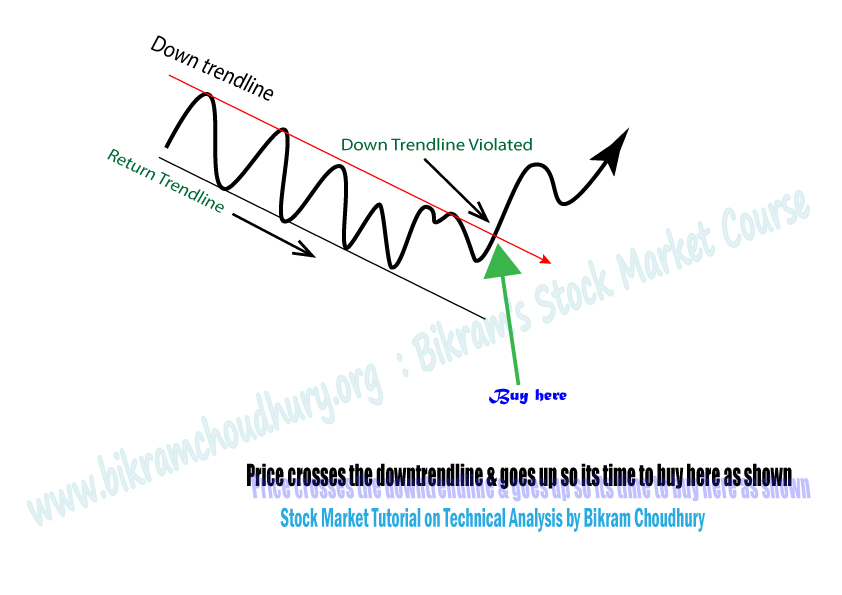
Case Study 3 : Down Trend Reversal of Stock Price – How to track, a share price trend reversed.
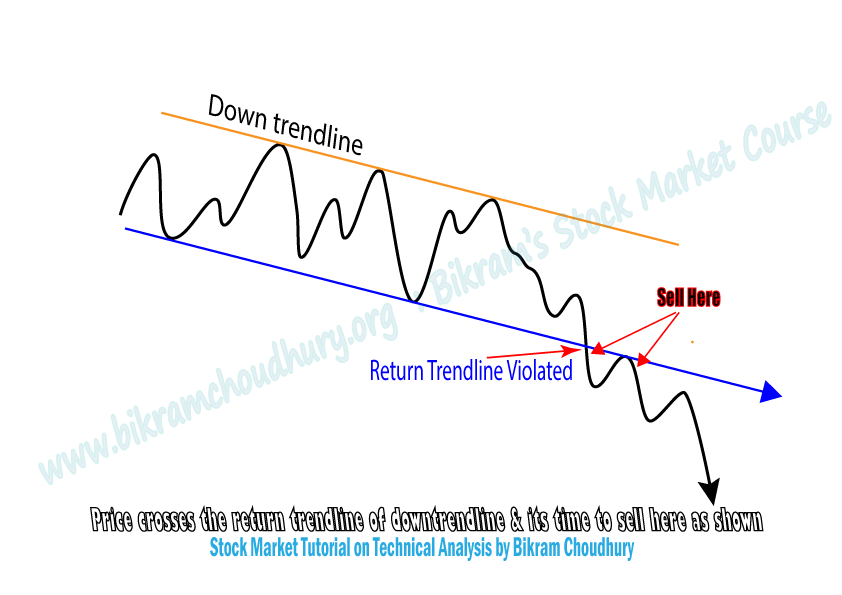
Case Study 4 : Downtrend line becomes more steep, how to sell again in a downtrend, a stock market technical analysis tutorial by Bikram Choudhury Kolkata
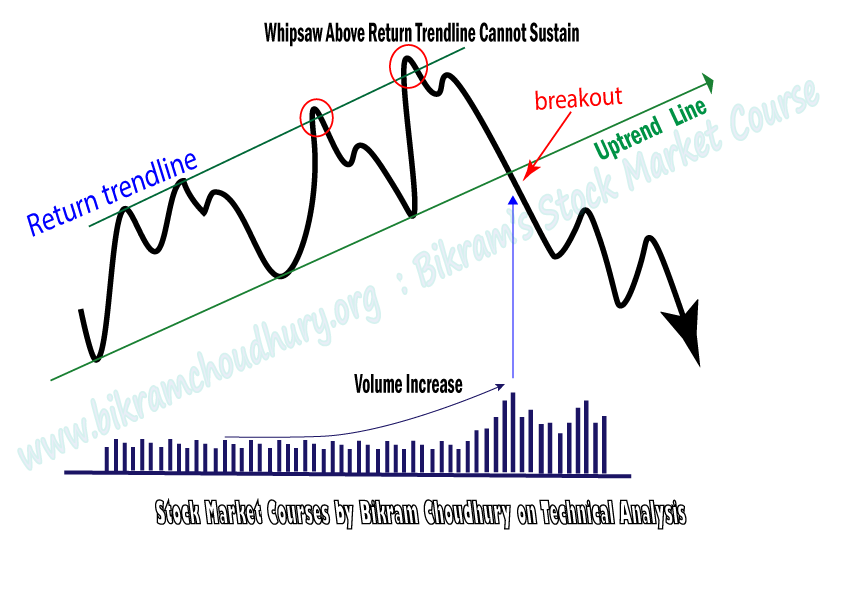
Case Study 5 : Whipsaw created above return trend line in uptrend, a share market technical analysis tutorial by Bikram Choudhury
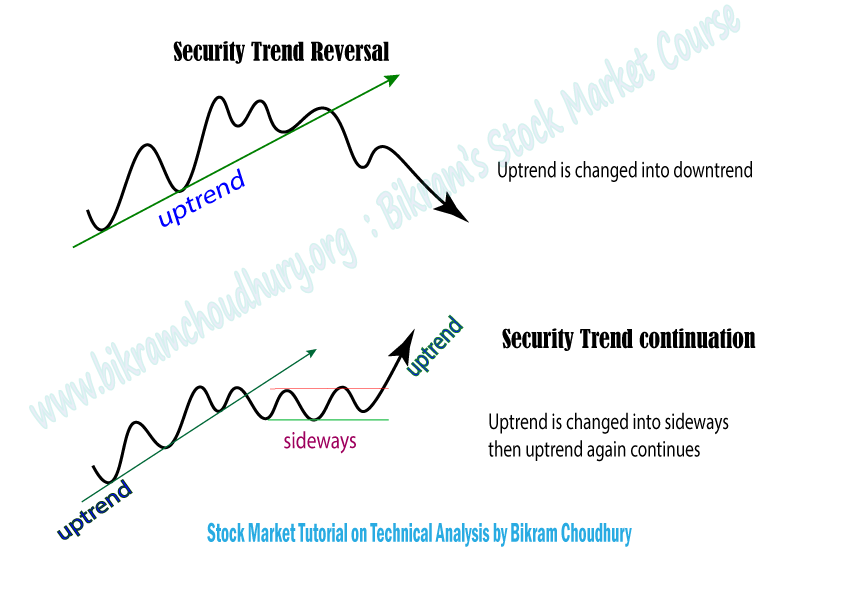
Case study 6: Trend reversal and trend continuation, a stock market technical analysis tutorial on stock trend by Bikram Choudhury
Learn Candlestick Chart
- Bullish candlestick charts
- Bearish candle stick charts
- Multiple candlestick chart patterns.
- Single candlestick patterns and ..
- Different examples on candle stick charts
- How to trade Intraday using Technical Analysis
Free technical analysis tutorial articles
Share Trading Courses
- Learn options trading online courses for India
- Learn stock market Intraday trading or Day Trading courses
- Live online courses on share technical analysis
Technical Analysis Bengali Video Tutorials :
Candlestick patterns in Share Market Technical Analysis, YouTube video tutorial
Support & Resistance Explained in Share Market Technical Analysis, a YouTube tutorial video by Share Market Teacher Mr Bikram Choudhury