Triangle patterns are not very reliable pattern. They work as consolidation or reversal pattern.
Symmetric triangle pattern also known as coils. Because finally price & volume breakout happens like a spring / coil, & sharp increase happens.
Breakout works best when breakout happens k/2 & 3k/4 where xy line length = k, i.e. via shaded area.
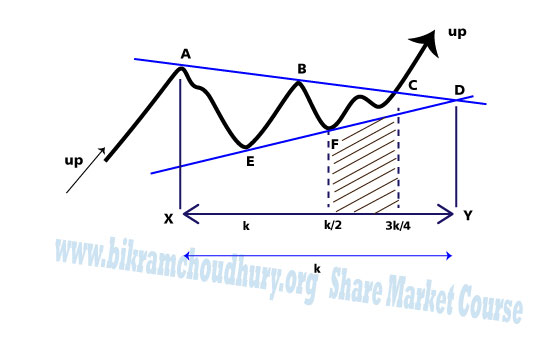
Image 1 – symmetrical pattern drawing – upside breakout
Symmetrical Triangle Pattern:
- Consist of minimum 2 rallies. Normally 2 to 3 rallies & reactions form a symmetrical triangle.
- Each peak formed lower than just previous peak (top).
- Each bottom forms at higher price, than just previous bottom.
- All the peaks joined by the line & all the troughs joined by the line forms the triangle, & they converge at a point.
- During triangle formation VOLUME reduces with time.
- The more number of peaks or troughs aligned in a side of triangle, then the pattern’s significance increases, then the breakout will be more significant when triangle pattern will be broken.
- Until breakout you do not know in which side the breakout will appear eventually.
- Breakout with HIGH VOLUME is good for sustaining the breakout.
Sides of Triangle Pattern: The sides of all types of triangles has great significance if they are touched by peaks of troughs much more times. So when the patterns are violated they work as dynamic support & resistance lines.
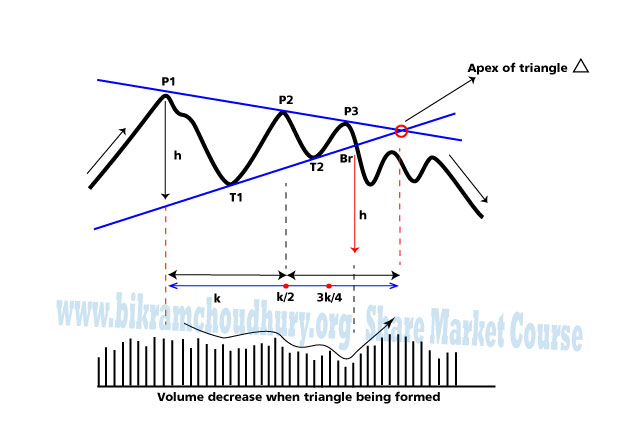
Right Angled Triangle:
- One side of the triangle is flat or horizontal.
- Otherwise similar to symmetrical triangle
- Normally breakout occurs via flat or horizontal side.
Flat Base Right Angled Triangle Pattern
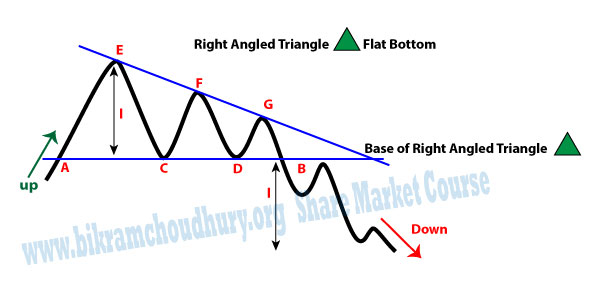
Flat Top Right Angled Triangle Pattern

Sometimes looks like rectangle pattern. In the following image a right angled going to be reversal pattern converted into a rectangle continuation pattern. Ref. fig (c-1) & (c-2) Flat Base Right Angled Triangle Pattern
Triangle Continuation Patterns in Actual Chart
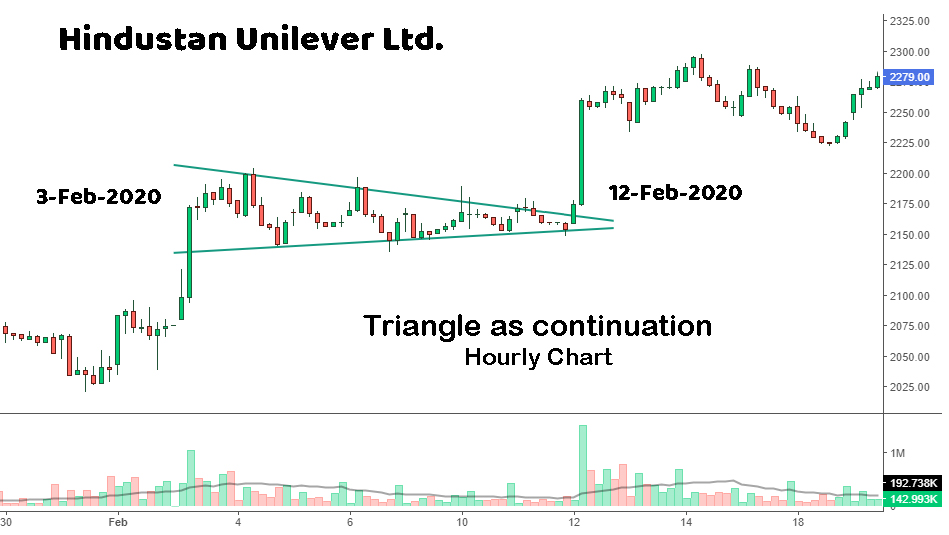
Hindustan Unilever Hourly Chart : Triangle pattern as continuation pattern seen between 3/Feb/2020 to 12/Feb/2020

SBI 5 minutes candlestick chart on 7 July 2020 between 1PM to 3:30 PM: Flat Top Right angled Triangle Pattern seen, breakout next day
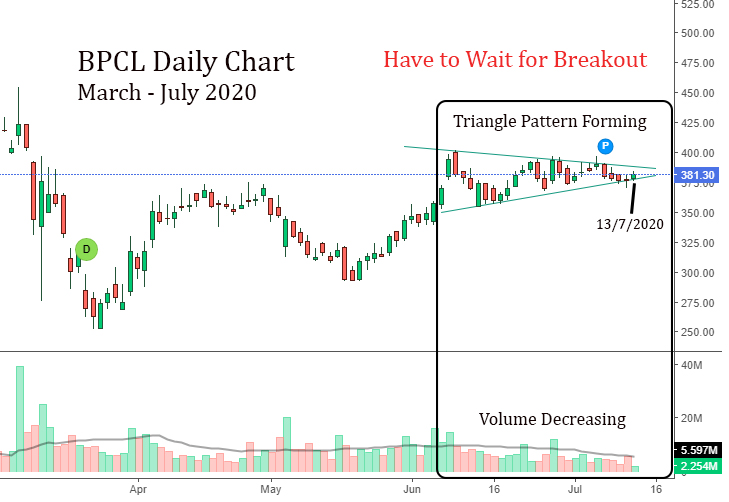
BPCL Daily Chart Jun to 13/July 2020– Symmetrical Triangle Pattern in Formation, wait for breakout
BPCL Daily Chart Jun to 13/July 2020– Symmetrical Triangle Pattern in Formation, wait for breakout